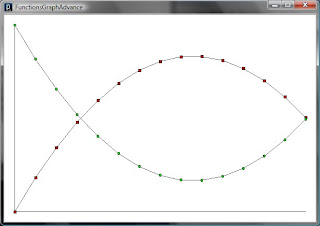
So, we can draw fancy pictures by using functions, what about something more… practical? Let’s visit our old friend ‘the graph’.
Graphs are made up of a number of distinct elements, these elements may vary in depictions, but they are all basically the same: this means we can generalise them!
The basic elements of a graph are: the axes; the data points; and the labels. We learnt earlier about arrays, these are ideal for holding the values for the data points and labels, and the axes can be automatically calculated to accommodate the given data points.
To start off, we have a number of items that we need to declare globally for controlling our graph:
//Define our point types
int doCIRCLE = 1;
int doSQUARE = 2;
//Define viewport
int vpHEIGHT = 400;
int vpWIDTH = 400;
//Define our margin
int margin = 20;
//Define our scaling factors (calculated in the code)
float xFactor, yFactor;
float xOffset, yOffset;
float xVIEWOFFSET, yVIEWOFFSET;
//Define data point size (how big to draw the squares or circles)
float pSIZE = 5;
And, of course, we’ll need some data points… let’s have two simple straight lines for this demonstration:
//Define our data points
float dp1[] = {1,2,3,4,5,6,7,8,9,10};
float dp2[] = {10,9,8,7,6,5,4,3,2,1};
Drawing the axes is easy, so let’s get that out of the way immediately:
void drawAxes () {
float bottom = vpHEIGHT-margin ;
float right = vpWIDTH-margin ;
// Draw Y axis
line(margin,bottom,margin,margin);
// Draw X axis
line(margin,bottom,right,bottom);
}
Slightly more complicated is the calculating of the factors for the point drawing. Wouldn’t it be nice if we could just have a routine that would take all the data points and do the number crunching away from the main stream of the program? Well the magic of the function argument list allows us to pass arrays as well as single floats or integers… we can have a function that takes the two arrays and sets up the factors before coming back to us. Great.
void calculateFactors(float[] data1, float[] data2) {
// We are looking for minimum and maximum data points.
// This is only set up to expect two sets of data points,
// a truly flexible routine would take an array of arrays!
float minY = min ( min(data1), min(data2) );
float maxY = max ( max(data1), max(data2) );
// Check how many data points we have -- check in both
// arrays just in case they aren't the same!
float count = max ( data1.length, data2.length );
// Set our offsets working from the bottom left corner, so
// that we don't need to be concerned about such things
// during the graph plotting process.
xVIEWOFFSET = margin ;
yVIEWOFFSET = vpHEIGHT - margin ;
// The y range should fit neatly between the top and
// bottom of the graph --- automatically taking care of
// the inversion of the viewport.
// Subtracting maxY from minY gives us a negative factor!
yFACTOR = (float)(vpHEIGHT - margin * 2) / (minY - maxY) ;
// The x range should spread out across the x axis, this
// is simply the width of the graph divided by the number
// of points
xFACTOR = (float)(vpWIDTH - margin * 2) / (count - 1) ;
// The offsets within the drawing area help us to move
// into the area of graph rather than always being zero
// based
xOFFSET = 0 ;
yOFFSET = - minY ;
}
Now that we’ve got the scaling sorted, we can just go ahead and plot our points. That sounds like a cue for another function. The last function that we’ll look at here is one to loop through the data point array and plot them on the graph, again the arguments do the magic by taking an array of floats, and in this case the type of point that we want to be drawn.
void plotPoints(float[] data, int shapeType) {
// Loop through plotting the appropriate points
for ( int i = 0 ; i < style=""> float x = xVIEWOFFSET + ( i + xOFFSET ) * xFACTOR ;
float y = yVIEWOFFSET + ( data[i] + yOFFSET ) * yFACTOR ;
drawShape(shapeType, x, y, pSIZE) ;
}
}
This is a very simple routine for plotting the points, it could be easily expanded to draw lines between the points (this would be done first with so that the points were ‘on top’ of the lines), or to draw histograms, or to include curve fitting and so on. The type of thing that you would not include would be extensive statistical analysis and the like – that belongs in a completely separate function.
Now, bringing all these functions together, we have a comparatively short program that can perform a fairly impressive purpose:
 void setup(){
size(vpWIDTH,vpHEIGHT);
background(255);
calculateFactors(dp1,dp2);
drawAxes();
fill(224,0,0);
plotPoints(dp1,doSQUARE);
fill(0,224,0);
plotPoints(dp2,doCIRCLE);
}
As can be seen from the result, this particular pair of graphs is nothing heroic, but if you play with the values in dp1 and dp2, along with the other configuration variables you can find different results.
 Modifying the plotPoints function to draw connecting lines, and then giving appropriate data points, it is possible to even draw rudimentary pictures.
It all seems a little fishy to me though.
